


We use cookies on this site to enhance your experience.
By selecting “Accept” and continuing to use this website, you consent to the use of cookies.

Appendix A is a supplementary document to the 2022/23 Responsible Investing report.
Figure 1. Carbon Emissions – FFF Canadian Equities
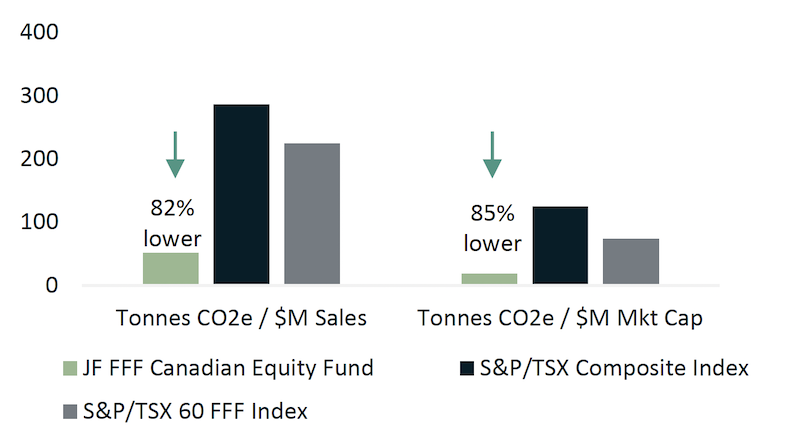
A bar graph of carbon emissions in Canadian Equities comparing tonnes CO2e per sales in millions to tonnes CO2e per market capital in millions for the JF FFF Canadian Equity Fund, S&P/TSX Composite Index, S&P/TSX 60 FFF Index. The chart shows that the JF FFF Canadian Equity Fund has 82% lower reported tonnes CO2e per sales in millions, and 85% lower CO2e per market capital in millions than the other two indices.
Figure 2. Sector Attribution
| Weighted Average Carbon Intensity by Sector | JF FFF Canadian Equity Fund | S&P/TSX Composite Index | S&P/TSX 6 0 FFF Index | JF FFF Canadian Equity Fund vs. S&P/TSX Composite Index | JF FFF Canadian Equity Fund vs. FFF Index |
|---|---|---|---|---|---|
| Industrials | 128.9 | 403.9 | 452.2 | -68.1% | -71.5% |
| Materials | 100.2 | 314.4 | 311.4 | -68.1% | -67.8% |
| Cons. Disc. | 53.3 | 30.3 | 31.0 | 75.9% | 71.8% |
| Cons. Staples | 31.9 | 24.8 | 20.8 | 29.0% | 53.7% |
| Real Estate | 6.4 | 74.0 | 79.1 | -91.3% | -91.9% |
| Info. Tech. | 5.6 | 4.0 | 3.5 | 39.7% | 60.4% |
| Health Care | 2.7 | 49.2 | N/A | -94.5% | N/A |
| Financials | 2.6 | 2.4 | 2.4 | 7.6% | 6.5% |
| Utilities | N/A | 1,253.3 | 1,208.4 | N/A | N/A |
| Comm. Serv. | N/A | 15.4 | 15.9 | N/A | N/A |
| Energy | N/A | 796.7 | 826.7 | N/A | N/A |
| Overall | 51.5 | 286.4 | 224.7 | -82.0% | -77.1% |
Figure 3. Largest contributions to portfolio's weighted average carbon intensity
| Company | Sector | Portfolio Weight | Carbon Intensity | Contribution to Portfolio Carbon Intensity | Emissions Source |
|---|---|---|---|---|---|
| CN Rail | Industrials | 7.3% | 462 | 65.6% | Reported |
| Gildan Inc. | Consumer Disc. | 3.0% | 129 | 7.6% | Reported |
| CCL Industries Inc. | Materials | 3.4% | 88 | 5.8% | Reported |
| Winpak LTD. | Materials | 1.2% | 134 | 3.1% | Reported |
| Magna International | Consumer Disc. | 2.7% | 44 | 2.3% | Reported |
Holdings as at June 30, 2023. Carbon metrics and reporting generated on July 10, 2023. Portfolio weights are ex cash. Carbon Intensity = t CO2e/$M USD Sales. Emissions include Scope 1 and Scope 2 Emissions. For portfolio, data availability is 100% with 11.8% comprised of MSCI estimates; for S&P/TSX Composite Index, data availability is 99.7% with 8.4% comprised of MSCI estimates; for S&P/TSX 60 FFF Index, data availability is 100% with 3.6% comprised of MSCI estimates.
Disclosure: This report may contain information (the “Information”) sourced from MSCI Inc., its affiliates or information providers (the “MSCI Parties”) and may have been used to calculate scores, ratings or other indicators. The Information is for the recipient’s internal use only, and may not be reproduced/redisseminated in any form, or used as a basis for or a component of any financial instruments or products or indices. The MSCI Parties do not warrant or guarantee the originality, accuracy and/or completeness of any data or Information herein and expressly disclaim all express or implied warranties, including of merchantability and fitness for a particular purpose. The Information is not intended to constitute investment advice or a recommendation to make (or refrain from making) any investment decision and may not be relied on as such, nor should it be taken as an indication or guarantee of any future performance, analysis, forecast or prediction. None of the MSCI Parties shall have any liability for any errors or omissions in connection with any data or Information herein, or any liability for any direct, indirect, special, punitive, consequential or any other damages (including lost profits) even if notified of the possibility of such damages.
Figure 1. Carbon Emissions – FFF Global Equities
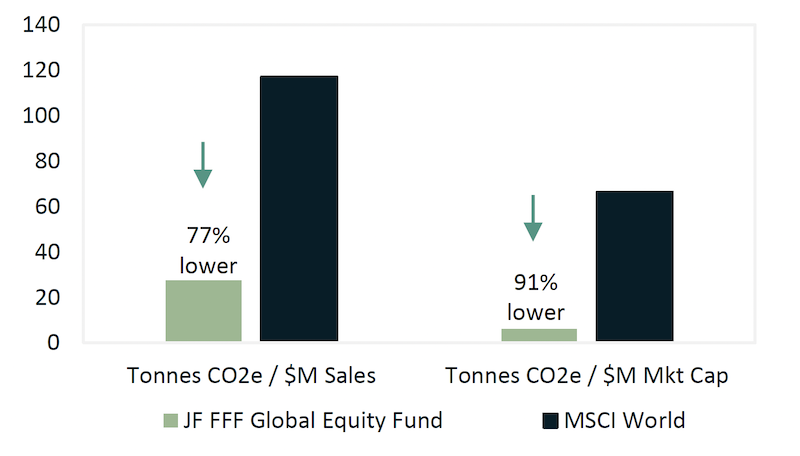
A bar graph of carbon emissions in global equities comparing tonnes CO2e per sales in millions to tonnes CO2e per market capital in millions for the JF FFF Global Equity fund and MSCI World index. The chart shows that the JF FFF Global Equity Fund has 77% lower reported tonnes of CO2e per sales in millions and 91% lower tonnes CO2e per market capital in millions than the MSCI World index.
Figure 2. Sector Attribution
| Weighted Average Carbon Intensity by Sector | JF FFF Global Equity Fund | MSCI World Index | JF FFF Global Equity vs. MSCI World Index |
|---|---|---|---|
| Industrials | 85.8 | 97.4 | -11.9% |
| Consumer Staples | 51.6 | 43.8 | 17.8% |
| Materials | 29.6 | 563.6 | -94.7% |
| Information Technology | 18.9 | 19.7 | -3.7% |
| Health Care | 17.1 | 15.4 | 10.5% |
| Consumer Discretionary | 17.0 | 52.6 | -67.8% |
| Communication Services | 7.3 | 11.9 | -38.7% |
| Financials | 6.0 | 18.4 | -67.4% |
| Utilities | N/A | 1,581.4 | N/A |
| Real Estate | N/A | 81.2 | N/A |
| Energy | N/A | 388.8 | N/A |
| Overall | 27.6 | 117.2 | -76.5% |
Figure 3. Largest contributions to portfolio's weighted average carbon intensity
| Company | Sector | Portfolio Weight | Carbon Intensity | Contribution to Portfolio Carbon Intensity | Emissions Source |
|---|---|---|---|---|---|
| CN Rail | Industrials | 2.0% | 462 | 33.6% | Reported |
| Microsoft Corporation | Info. Tech. | 6.2% | 33 | 7.4% | Reported |
| Nestle S.A. | Consumer Staples | 3.4% | 52 | 6.4% | Reported |
| Amazon.com Inc. | Consumer Disc. | 4.8% | 34 | 6.0% | Reported |
| Pepsico | Consumer Staples | 2.1% | 68 | 5.2% | Reported |
Holdings as at June 30, 2023. Carbon metrics and reporting generated on July 5, 2023. Portfolio weights are ex cash. Carbon Intensity = t CO2e/$M USD Sales. Emissions include Scope 1 and Scope 2 Emissions. For portfolio, data availability is 100% with 8.4% comprised of MSCI estimates; for benchmark, data availability is 99.9% with 4.1% comprised of MSCI estimates.
Disclosure: This report may contain information (the “Information”) sourced from MSCI Inc., its affiliates or information providers (the “MSCI Parties”) and may have been used to calculate scores, ratings or other indicators. The Information is for the recipient’s internal use only, and may not be reproduced/redisseminated in any form, or used as a basis for or a component of any financial instruments or products or indices. The MSCI Parties do not warrant or guarantee the originality, accuracy and/or completeness of any data or Information herein and expressly disclaim all express or implied warranties, including of merchantability and fitness for a particular purpose. The Information is not intended to constitute investment advice or a recommendation to make (or refrain from making) any investment decision and may not be relied on as such, nor should it be taken as an indication or guarantee of any future performance, analysis, forecast or prediction. None of the MSCI Parties shall have any liability for any errors or omissions in connection with any data or Information herein, or any liability for any direct, indirect, special, punitive, consequential or any other damages (including lost profits) even if notified of the possibility of such damages.
Figure 1. Carbon Emissions – FFF Bonds
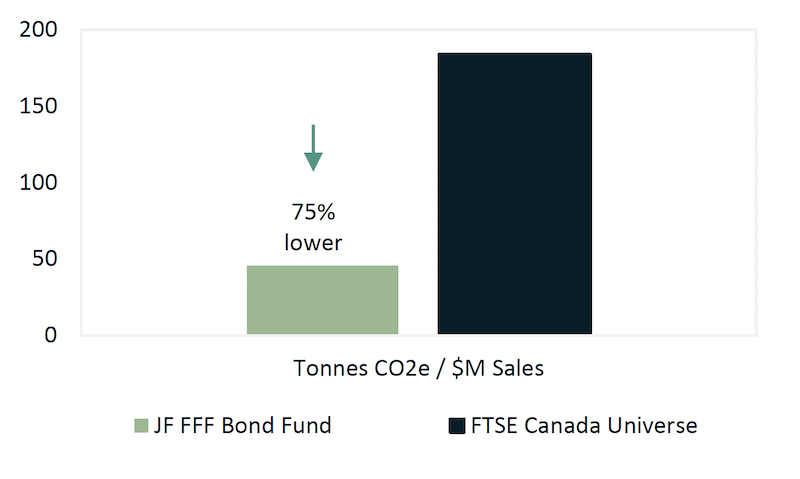
A bar graph of carbon emissions in bonds comparing tonnes CO2e per sales in millions for the JF FFF Bond Fund and the FTSE Canada Universe fund. The chart shows that the JF FFF Bond Fund has 75% lower reported tonnes of CO2e per sales in millions than the FTSE Canada Universe index.
Figure 2. Sector Attribution
| Weighted Average Carbon Intensity by Sector | JF FFF Bond Fund | FTSE Canada Universe | JF FFF Bond Fund vs. FTSE Canada Universe |
|---|---|---|---|
| Industrials | 326.7 | 218.0 | 49.8% |
| Utilities | 53.3 | 960.4 | -94.4% |
| Consumer Staples | 47.3 | 34.5 | 37.0% |
| Communication Services | 16.4 | 15.5 | 5.6% |
| Consumer Discretionary | 6.4 | 33.7 | -81.0% |
| Financials | 3.9 | 39.6 | -90.2% |
| Information Technology | 0.2 | 184.1 | -99.9% |
| Materials | N/A | 87.7 | N/A |
| Health Care | N/A | 49.8 | N/A |
| Real Estate | N/A | 53.4 | N/A |
| Energy | N/A | 770.8 | N/A |
| Overall | 45.7 | 184.2 | -75.2% |
Figure 3. Largest contributions to portfolio's weighted average carbon intensity
| Company | Sector | Portfolio Weight | Carbon Intensity | Contribution to Portfolio Carbon Intensity | Emissions Source |
|---|---|---|---|---|---|
| National Grid Electricity Trans. | Industrials | 2.6% | 525 | 49.3% | Reported |
| Ontario Power Generation Inc.1 | Utilities2 | 0.8% | 393 | 12.0% | Reported |
| CN Rail | Industrials | 0.6% | 462 | 10.2% | Reported |
| Hydro One Inc. | Utilities | 4.0% | 53.3 | 7.7% | Reported |
| Heathrow Funding Limited | Industrials | 2.0% | 48 | 3.5% | Reported |
Holdings as at June 30, 2023. Carbon metrics and reporting generated on July 10, 2023. Portfolio weights are ex cash. Carbon Intensity = t CO2e/$M USD Sales. Emissions include Scope 1 and Scope 2 Emissions. For portfolio, data availability is 58.0% with 8.2% comprised of MSCI estimates; for benchmark, data availability is 35.9% with 12.0% comprised of MSCI estimates. Data availability is lower for bond funds because of the inclusion of government bonds. Weighted Average Carbon Intensity is the recommended metric for Fixed Income portfolios.
1. The OPG bond in the FFF Bond Fund is a green bond used to finance renewable electricity projects, but the emissions reported here are at the overall corporation level.
2. Note that MSCI has classified Ontario Power Generation Inc.’s sector as “N/A”. Therefore, its intensity is not reflected in the sector attribution chart above.
Disclosure: This report may contain information (the “Information”) sourced from MSCI Inc., its affiliates or information providers (the “MSCI Parties”) and may have been used to calculate scores, ratings or other indicators. The Information is for the recipient’s internal use only, and may not be reproduced/redisseminated in any form, or used as a basis for or a component of any financial instruments or products or indices. The MSCI Parties do not warrant or guarantee the originality, accuracy and/or completeness of any data or Information herein and expressly disclaim all express or implied warranties, including of merchantability and fitness for a particular purpose. The Information is not intended to constitute investment advice or a recommendation to make (or refrain from making) any investment decision and may not be relied on as such, nor should it be taken as an indication or guarantee of any future performance, analysis, forecast or prediction. None of the MSCI Parties shall have any liability for any errors or omissions in connection with any data or Information herein, or any liability for any direct, indirect, special, punitive, consequential or any other damages (including lost profits) even if notified of the possibility of such damages.